

College Releases Class of 2030 Data
The college has released demographic data for the Class of 2030. This year’s class saw a three-point percentage increase in its number of Black or African American students and a six-point percentage decrease in its Latinx students compared to the Class of 2029.
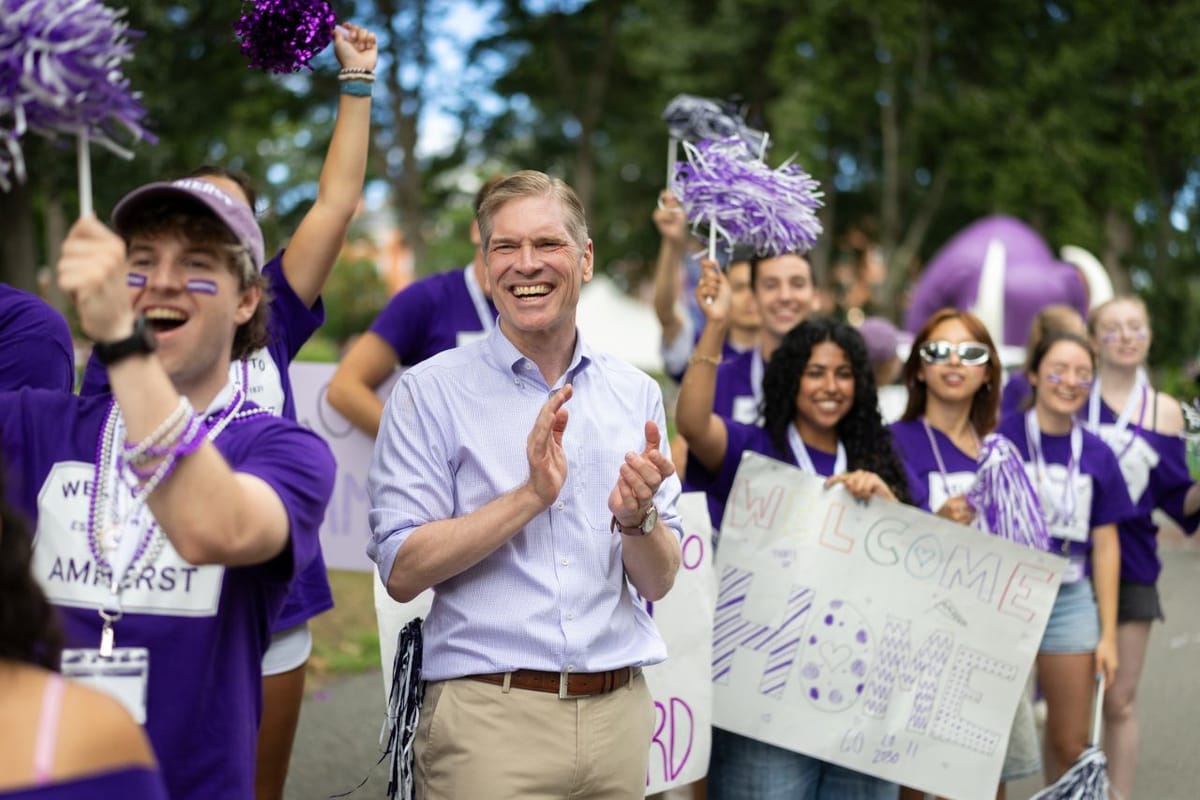
The college recently released its admission and enrollment profile for the Class of 2030, the third class to be admitted following the Supreme Court’s 2023 decisions in Students for Fair Admissions (SFFA) Inc. v. Harvard College and Students for Fair Admissions, Inc v. University of North Carolina, which banned the use of race-based affirmative action in admissions. Compared to the Class of 2029, the percentage of Black and African American students increased, while the percentage of Latinx students decreased.
According to federal reporting guidelines, 9% of the Class of 2030 is Black or African American, an increase compared to 6% of the Class of 2029 and 3% of the Class of 2028, though 16% of the class self-reported as Black or African American. The Class of 2028 was the first class admitted following the end of affirmative action, and its enrollment of 3% Black or African American students became the subject of widespread discussion on campus and national media, with New York Times and Wall Street Journal articles.The Latinx student percentage dropped six-percentage points from the Class of 2029, decreasing from 16% to 10% of the Class of 2030. Overall, 45% of the class self-identify as U.S. students of color.
Last year, the Class of 2029 achieved a record number of first-generation students and Questbridge marches, reaching 21% and 7% respectively. This year’s class saw a decrease — 17% and 4%, respectively. Additionally, 62% of the class received scholarship and grant aid, and 20% are Pell Grant recipients, a 1% increase and 5% decrease respectively from the Class of 2029.
For gender identity, 52% of the Class of 2030 identify as women, 47% as men, 2% as another gender identity, and 1% did not respond.
International students, who continue to face uncertainty regarding pending visa restrictions and limits on work authorization, make up 10% of the Class of 2030 — the same percentage as the Class of 2029, which was a six-percentage point drop from the Class of 2028. Overall, the Class of 2030 come from 42 states, including the District of Columbia and from 29 foreign countries.
Two years ago, the admissions office added a new position focusing on rural and small-town outreach with the goal to increase access more broadly. As a result, the Class of 2029 saw a record 11% of students from small or rural towns, and this year’s class saw a 1% increase.
In terms of enrollment, 42% of the class was admitted under early decision and 53% under regular decision. Of 17,786 applicants, 1,209 were admitted and 501 enrolled, resulting in a record-low 6.8% acceptance rate for the Class of 2030. The Class of 2029 had an 8% acceptance rate.

Comments ()